
Seedream 5.0 Infographic Prompts: Templates, Text Tips, and 5 Copy-Ready Examples
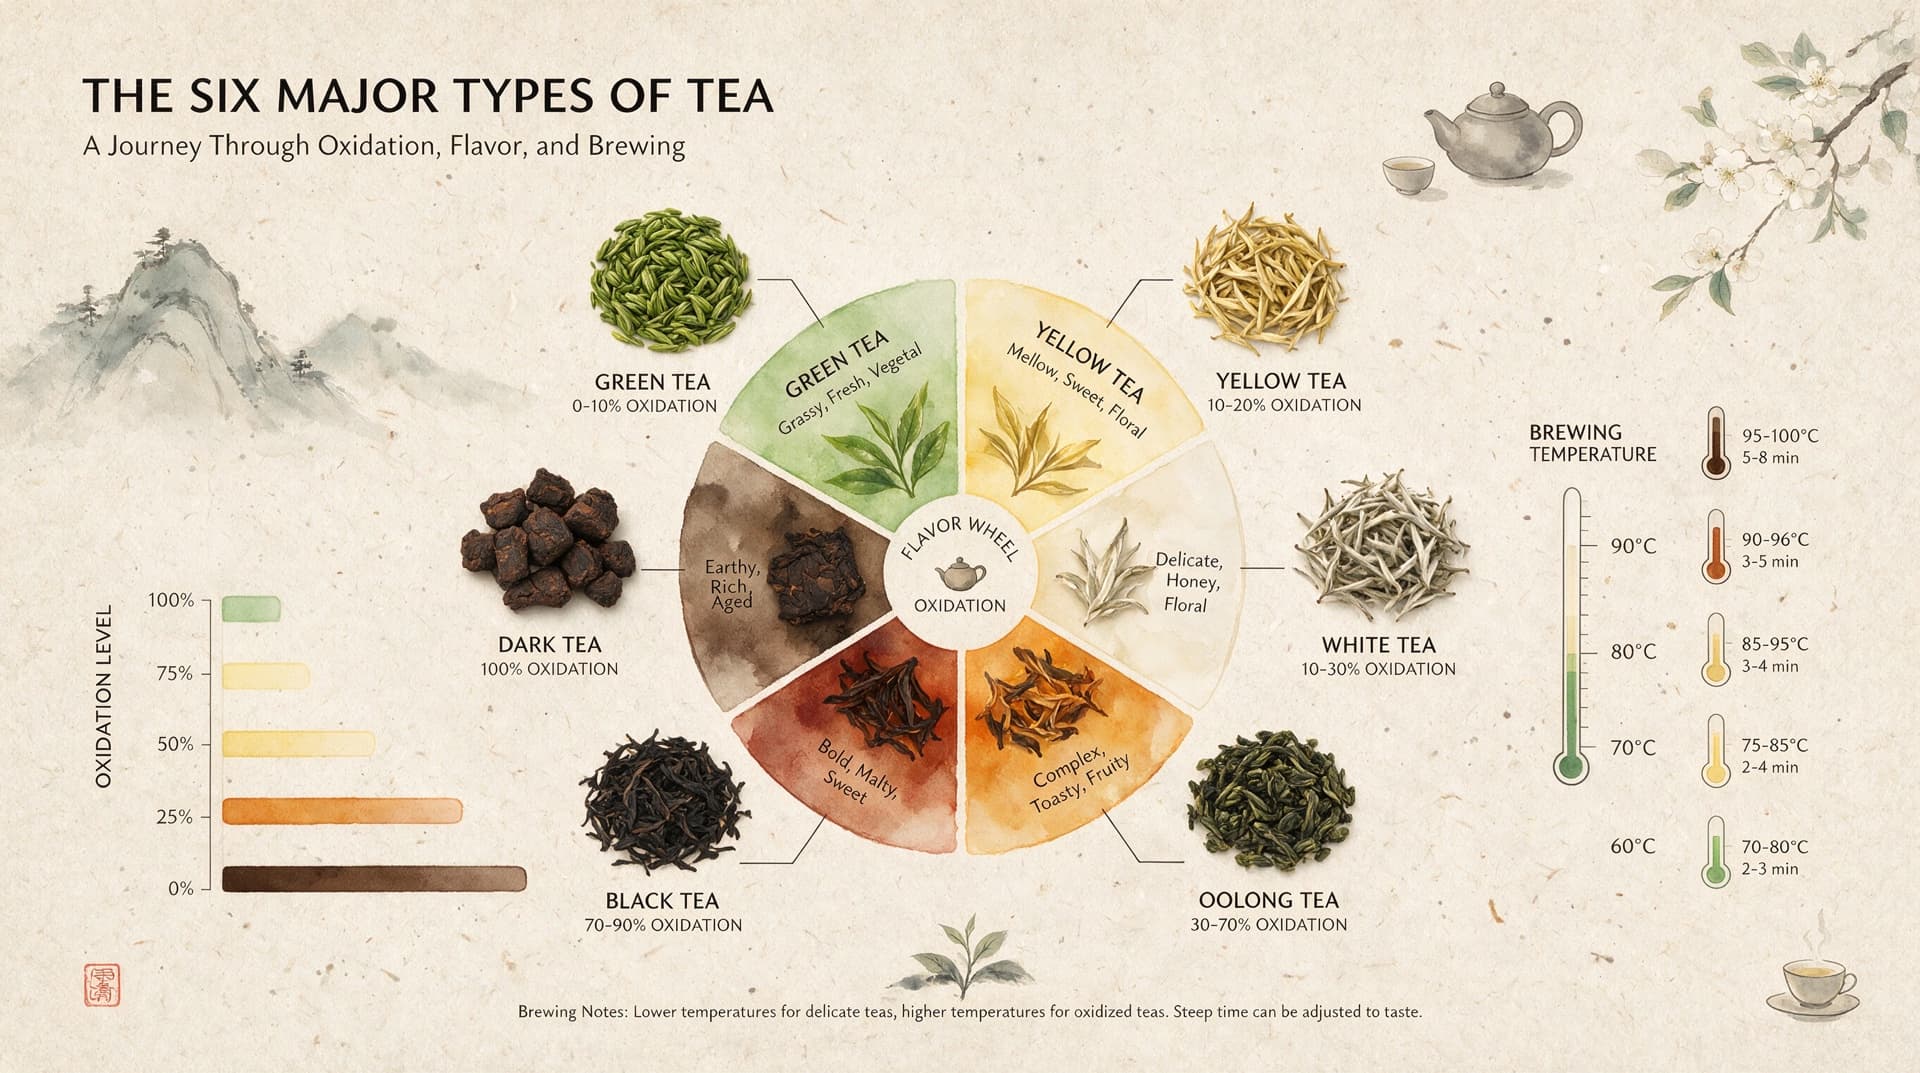
AI Overview
Can Seedream 5.0 generate infographics from a text prompt?
Yes. Seedream 5.0 Pro can turn a structured brief into an infographic with sections, charts, labels, and planned visual hierarchy. Always verify facts and small text before publishing.
How do you format text correctly in a Seedream 5.0 infographic prompt?
Put every exact label in double quotes, keep most labels to 3–5 words, and state its location and type style. Example: “Total Revenue: $2.4M,” bold sans-serif, top-right.
What infographic layouts work best with Seedream 5.0?
Timelines, process flows, two-column comparisons, stat cards, and single-chart layouts are dependable starting points. For dashboards, assign every chart to an explicit grid region.
Ready to try it yourself?
Free credits on signup. Plans from $20/month.
What should I include in a Seedream 5.0 infographic prompt?
Specify the topic and audience, aspect ratio, exact headline, section count, supplied data, chart type for each section, and a restrained palette. Add reading order and style last.
Why Seedream 5.0 Is Different for Infographics
Seedream 5.0 Pro is designed to interpret complex information, organize logical relationships, plan layouts, and render multilingual text in one image workflow. That combination matters because an infographic must do more than look polished: its hierarchy, numbers, labels, and reading order must work together.
General image models often produce attractive posters but weaken when the prompt contains several linked facts. Common failures include invented numbers, inconsistent chart scales, cramped captions, or sections that look unrelated. Seedream 5.0 gives you a stronger starting point, but it does not replace fact-checking or a final typography pass.
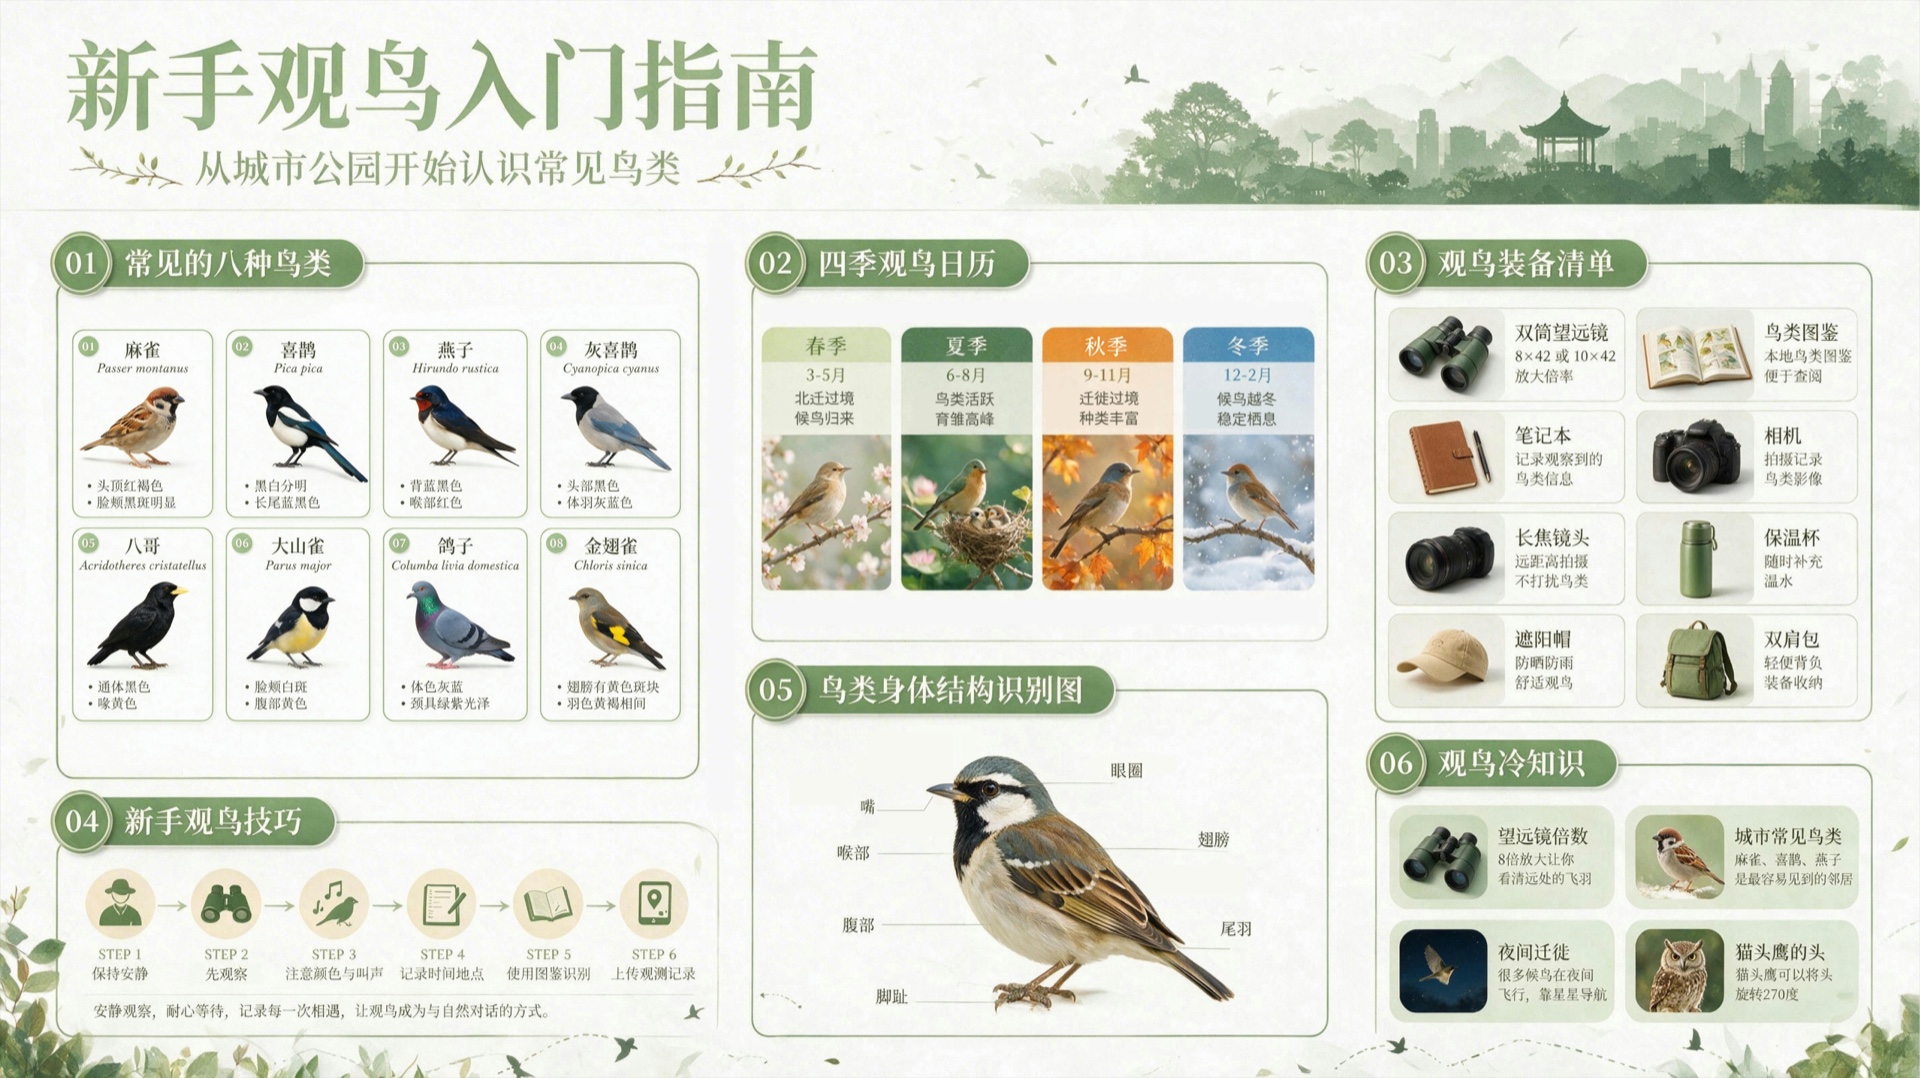
A complete infographic example: the grid, illustrations, icons, and short labels create a clear reading path without relying on one large block of text.
For a broader model comparison, read Seedream 5.0 vs Nano Banana 2. You can also test the same brief with Nano Banana, keeping the data and canvas identical so you compare layout decisions rather than different prompts.
The 7-Part Prompt Formula for Any Infographic
A useful prompt defines seven things in this order:
- Infographic type — timeline, process, comparison, stat cards, or chart.
- Topic and audience — what the visual explains and who will read it.
- Canvas ratio — for example, 16:9, 4:5, or A4 portrait.
- Exact headline — the title that must appear in the image.
- Number of regions — the page structure and reading order.
- Data and chart type per region — supply the facts; do not ask the model to invent them.
- Palette and visual style — keep colors and design language controlled.
Use this copy-ready formula:
[Infographic type] about [topic] for [audience], [canvas ratio].
Headline: "[main headline]".
Create [number] clearly separated regions in [reading order].
Region 1: [chart type] showing [data and exact labels].
Repeat for every region. Use only the supplied facts.
Palette: [colors]. Style: [design keywords].
Weak prompt: “Make an infographic about espresso.”
Stronger prompt:
Vertical 4:5 process infographic for beginner home baristas.
Headline: "Pull Better Espresso".
Create 4 numbered steps from top to bottom: "Dose 18g", "Yield 36g",
"Time 28 Seconds", and "Adjust the Grind". Add one simple line icon per step.
Palette: espresso brown, cream, muted orange. Clean editorial style.
The stronger version gives the model a layout, exact copy, controlled facts, and a visual system. That makes useful variation possible without surrendering the information architecture.
Prompt Templates by Infographic Type
Timeline
Horizontal 16:9 timeline infographic about [topic] for [audience].
Headline: "[headline]". Show [number] milestones from [start] to [end],
left to right. Each milestone has "[date]", "[short label]", and one icon.
Use only supplied milestones. Palette: [colors]. Style: [keywords].
Process Flow
Vertical 4:5 process infographic explaining [process] to [audience].
Headline: "[headline]". Create [number] numbered steps from top to bottom.
Each step includes "[step name]", one short action, and one icon.
Connect steps with arrows. Palette: [colors]. Style: [keywords].
Comparison
Two-column 16:9 comparison infographic for [audience].
Headline: "[headline]". Left column: "[option A]"; right: "[option B]".
Compare [number] aligned rows: [criteria and supplied values].
Use matching icons and equal visual weight. Palette: [colors].
Stat Callout Cards
Square 1:1 stat-card infographic about [topic].
Headline: "[headline]". Arrange [number] cards in a [grid] grid.
Each card contains one large supplied number, one 3–5 word label,
and one simple icon. Palette: [colors]. Style: [keywords].
Data Chart
Clean 16:9 data infographic for [audience]. Headline: "[headline]".
Place one [bar/line/donut] chart in the center using only this dataset:
[paste labels and values]. Label every value directly. Add a one-sentence
takeaway below the chart. Palette: [colors]. No decorative data.
Start with one of these structures in Text to Image, then change only the bracketed fields. Keeping the layout language stable makes prompt testing easier.
Getting Text Right — The Double-Quote Rule and Placement
Put all required copy in double quotes. Treat this as a practical prompt convention: it separates exact words from visual instructions. Short labels are easier to place, so aim for 3–5 words and move explanations into captions only when necessary.
Describe text with three coordinates: what it says, where it sits, and how it looks. For example: "Q2 Revenue: $2.4M", top-right card, bold condensed sans-serif. Avoid requests such as “add a nice title somewhere.”
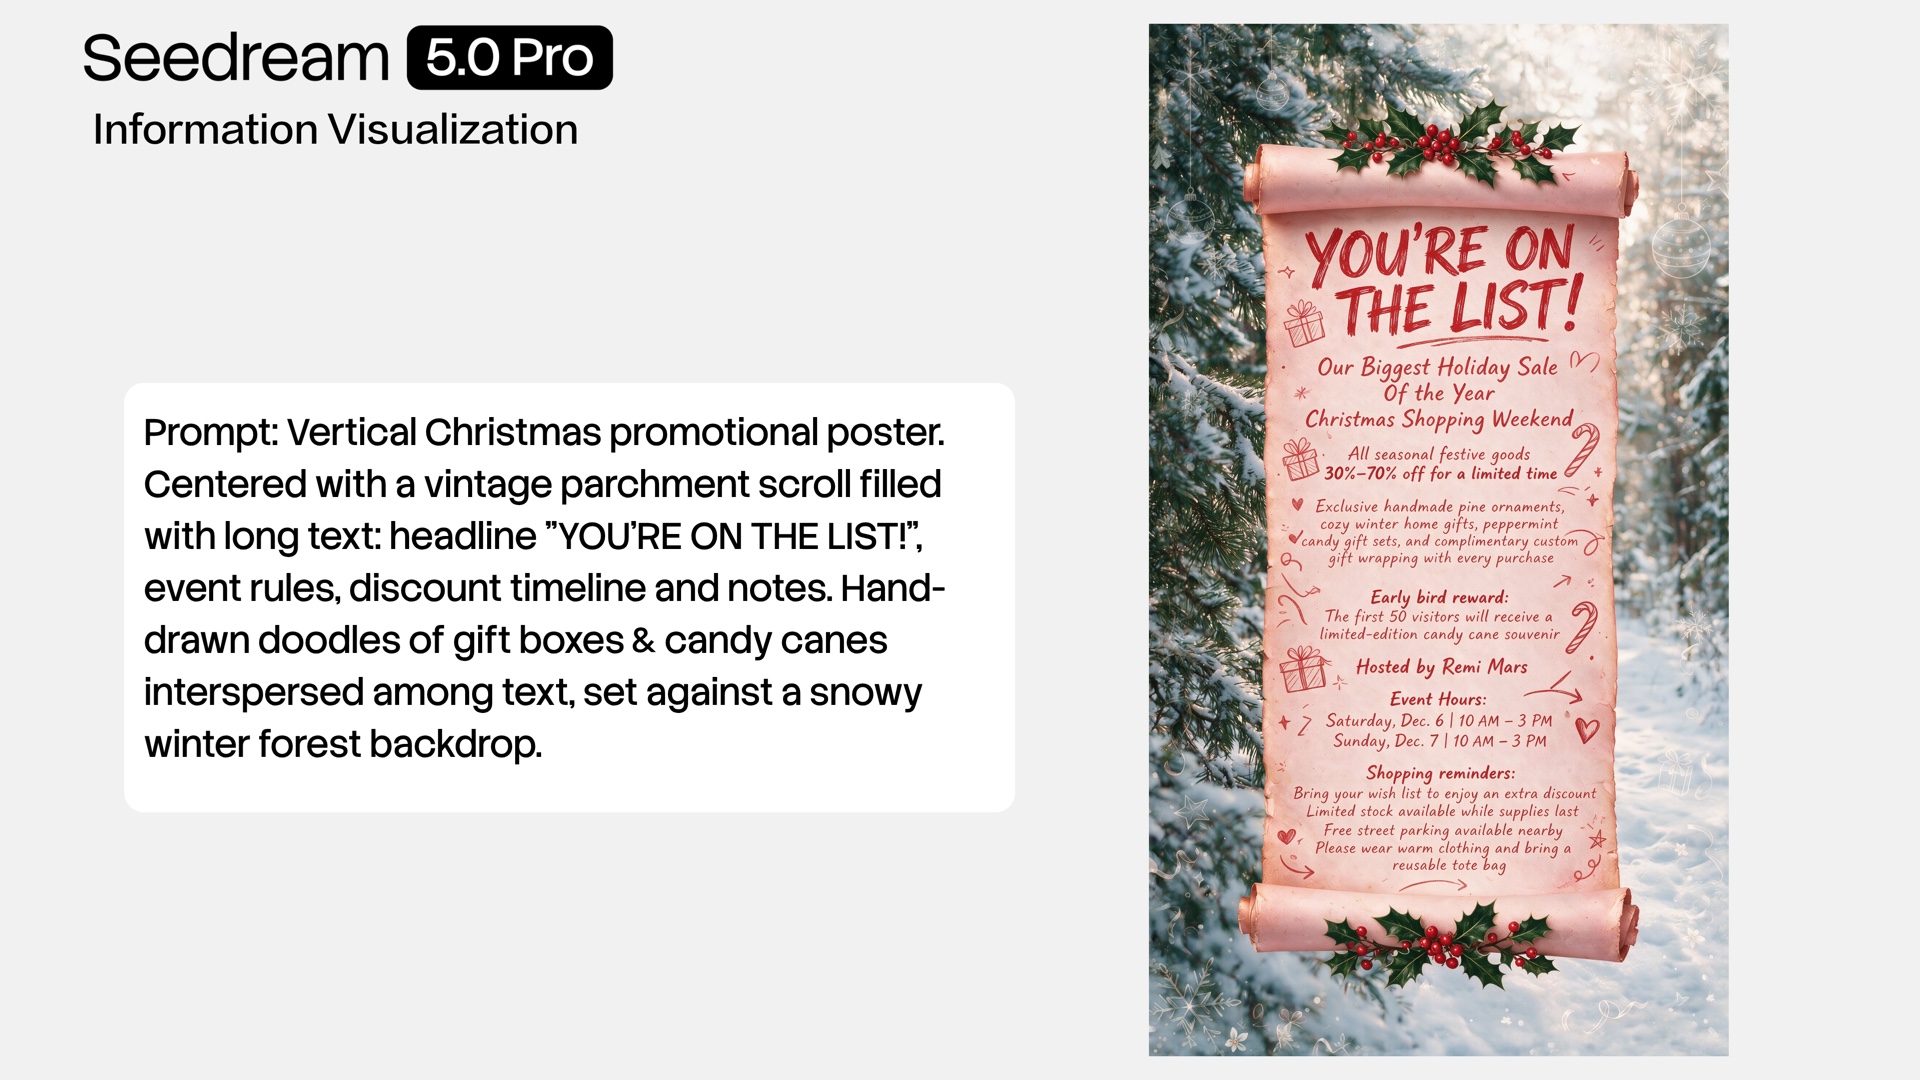
A text-heavy poster works best when the headline, discount, date, and CTA each have a defined role and position.
If text overflows, shorten the label or enlarge its region. If letters become gibberish, isolate the problem label and regenerate it with fewer words. If copy is offset, name the exact container: “centered inside the second card,” not simply “centered.” Always proofread at 100% zoom.
Prompts for 5 Real Use Cases
Ecommerce Product Comparison
Wide 16:9 ecommerce comparison infographic for first-time buyers.
Headline: "Choose Your Daily Bottle". Compare three fictional products—
"Trail 600", "City 750", "Sport 900"—across five rows: capacity
600/750/900 ml, weight 210/260/310 g, insulation 12/18/24 hours,
lid twist/flip/straw, price $24/$32/$39. Use only these values.
Three equal columns, checkmark icons, navy and mint palette, clean store style.
This format also works beside polished catalog visuals from Product Photos.
Social Marketing Report
Square 1:1 monthly marketing report for an executive audience.
Headline: "June Growth Snapshot". Create four stat cards in a 2x2 grid:
"Audience Growth +18%", "Conversion 4.6%", "CPM $8.20", "ROAS 3.4x".
Use only these sample values. Add small upward, funnel, cost, and return icons.
Dark navy background, lime accents, high-contrast dashboard style.
Product Onboarding Flow
Vertical 4:5 onboarding flow for new project-management app users.
Headline: "Start in Five Steps". Show five connected steps top to bottom:
"Create a Workspace", "Invite Your Team", "Add a Project",
"Assign the First Task", "Review Progress". One simple UI icon per step.
Blue-to-violet palette, rounded cards, friendly SaaS illustration style.
AI Video Industry Timeline
Horizontal 16:9 editorial timeline titled "AI Video: 2020–2026".
Create seven annual milestone slots from 2020 through 2026, left to right.
Use these placeholder labels only: "Research Phase", "Text-to-Video",
"Creator Tools", "Longer Clips", "Better Control", "Agent Workflows",
"Production Systems". Add one icon and one empty caption area per year.
Black, white, and electric blue palette. Do not invent companies or metrics.
Replace the placeholder milestones with verified sources before publication.
Educational Science Flowchart
Landscape 16:9 classroom flowchart for students aged 10–12.
Headline: "The Water Cycle". Show four clockwise stages:
"Evaporation", "Condensation", "Precipitation", "Collection".
Add ocean, cloud, rain, and river illustrations; connect every stage with arrows.
Include one 5-word caption under each stage. Sky blue, teal, and white palette.
Friendly textbook style, scientifically clear, no extra stages.
Common Mistakes and How to Fix Them
| Mistake | Fix |
|---|---|
| No layout direction | Name the format, region count, grid, and reading order. |
| Topic only, with no data | Paste verified values and say “use only supplied facts.” |
| Vague chart type | Request one specific chart and map labels to values. |
| Too many colors | Limit the palette to two main colors plus one accent. |
| Several charts without regions | Assign each chart to a numbered card or grid cell. |
| No aspect ratio | State the delivery ratio before describing content. |
Do not judge success only by visual polish. Check that totals are correct, scales are honest, dates are ordered, repeated labels match, and no new numbers appeared. If accuracy matters, create the data table first and use the generated image as a designed draft—not as the source of truth.
Conclusion
Reliable infographic prompts are structured briefs: choose one of five layouts, then define the audience, canvas, exact headline, section count, supplied data, chart types, and palette. Keep labels short, quote required text, place every element explicitly, and proofread the result. When the brief is ready, open Seedance, try it with Seedream 5.0, and refine one variable at a time.
Ready to try it yourself?
Put the steps from this guide into practice with Seedance and turn prompts or images into polished videos in minutes.
Free credits on signup. Plans from $20/month.
Related Articles
More posts in the same locale you may want to read next.
Seedance App Preview Video Generator 2026: Create App Store and Product Launch Clips
Use Seedance to turn app screenshots, feature copy, and launch goals into App Store previews, Google Play promo videos, and product launch clips.
Read article
Seedream 5.0 Product Poster Prompts: Templates, Lighting, and Background Swap Guide
Create stronger product posters with a six-part Seedream 5.0 prompt formula, five product templates, three lighting setups, text rules, and a background-swap workflow.
Read article
Seedream 5.0 vs Nano Banana 2: Speed, Quality, and Which to Use in 2026
Compare Seedream 5.0 and Nano Banana 2 for speed, image quality, character consistency, pricing, ecommerce, multilingual design, and production workflows.
Read article